Charting in PowerPoint
In this article, we will show you step-by-step how to add charts in Microsoft PowerPoint 2013, how to edit them. change the chart type, and change the chart attributes.
For instructor-led PowerPoint classes in Los Angeles call us on 888.815.0604. Onsite PowerPoint training available countrywide.
How to insert a Chart
- Create a new blank slide.
-
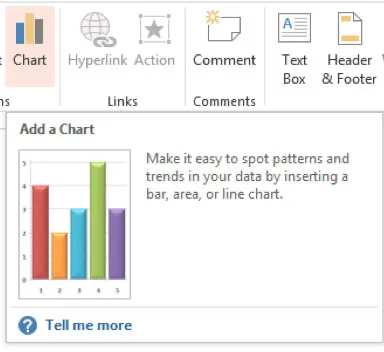
Click on the Chart icon From the Title and Content layout or choose Insert Chart from the Illustrations Group of the Insert Tab.

- Choose the Chart Layout you require, click OK.
-
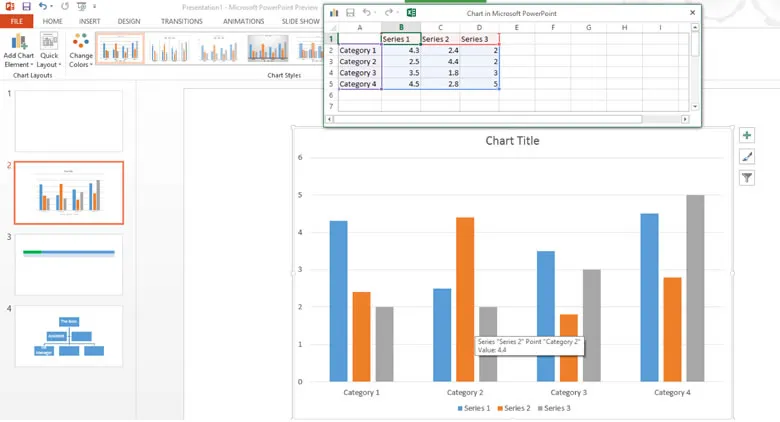
A Microsoft Excel will Chart will open on the Slide. Excel contains the data source used by the chart. Enter the data you require into this chart and then close the Excel Chart.

-
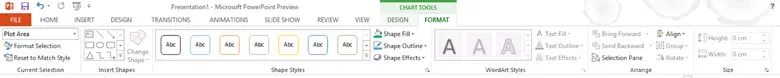
When a chart is selected in PowerPoint the Chart Tools Tab will appear in the Ribbon. These 2 tabs contain all controls needed for the design and formatting of charts

Read more about PowerPoint 2016 Charts
Editing the Chart
In order to change the chart you must have the Chart Tools Ribbons active. You can change the look of the chart at any time by using the icons on the Chart Tools Ribbons
Changing the Chart Type
- Activate the Chart by clicking inside the border.
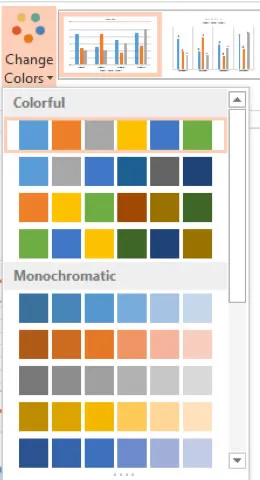
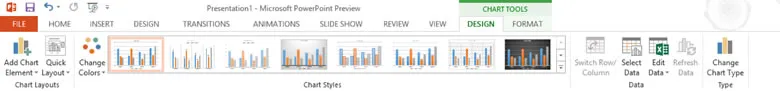
- On the Chart Tools, Design Tab change the Chart Layout and colour scheme if applicable.
How to Change Chart Attributes
- Each element of the chart can be selected and changed, for example the chart Title area or the chart colours can be accessed under the Design menu.
-
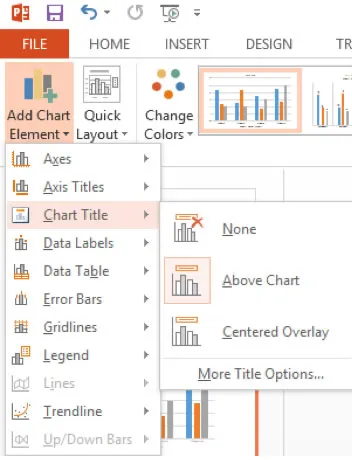
Select the dropdown arrow next to Add Chart Element. Here you can change where the Chart Title is located.