Customising the Gantt Chart in MS Project
The Gantt Chart is a horizontal bar chart that represents each task in the time scale of the project. Each task entered in the project will be shown and by default the name of the resource allocated to the task appear next to the bars.
Gantt Charts form the significant part of a regular communication about your project and can be quickly formatted to display the critical tasks, the current progress, comparison with the original plan, and the new projected completion.
For instructor-led Microsoft Project training in Los Angeles call us on 888.815.0604.
Critical Path
Critical Path Analysis or CPA is an important part of project management. It will enable you to interrogate the tasks in your project to see which tasks form the basis of a successful completion of the project.
These tasks, should they be delayed or indeed, completed sooner than planned will have a critical and fundamental impact on your project.
We need to be able to view these statistics from time to time and it will enable us, by viewing them, to either shorten the plan or concentrate on costs.
When you use Auto Schedule mode, Project schedules the tasks based on the project start or finish date and any task relationships you have defined. Using the scheduled start and finish dates, Project determines which tasks must finish on time for the project to finish on time.
Because other tasks are linked to the critical tasks, if a critical task finishes late, it causes all of the tasks that follow, to start and finish late. By extension, the project finishes late. Conversely, if a critical task finishes early, the project can finish early.
In the example below we have three tasks that are all due to start on the same day and each has varying durations:
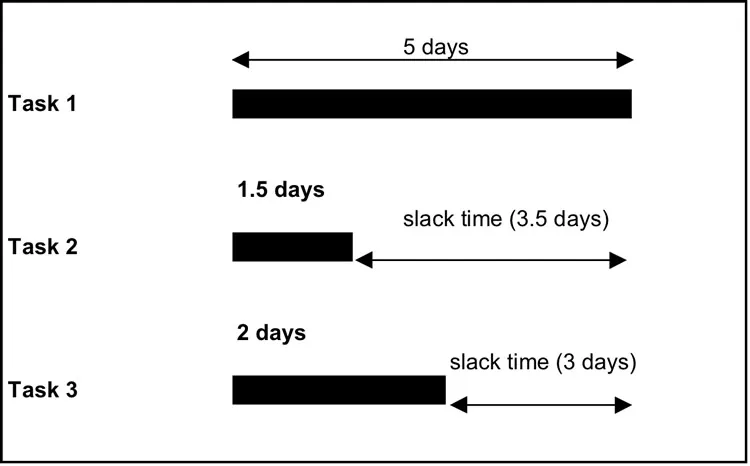
Task 1 is the longest task; Tasks 2 and 3 are not linked to Task 1, which has the longest duration. So long as they are completed prior to the end of Task 1 the project will not overrun.
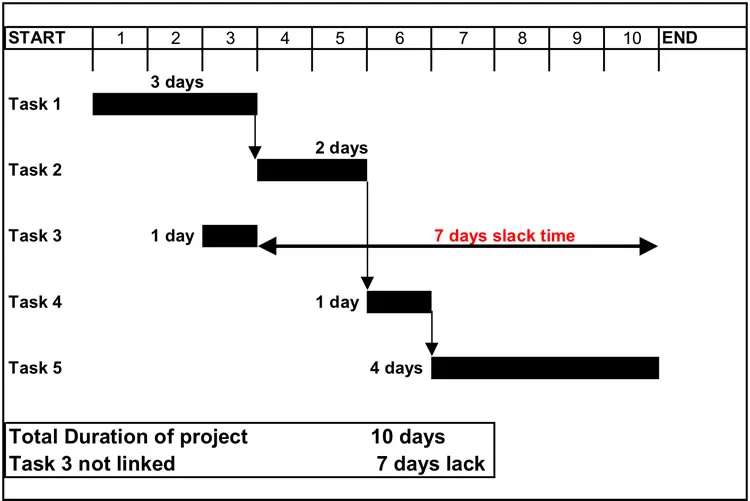
In most projects, you have many tasks linked to one another with numerous relationships. If you link all the tasks with only Finish-to-Start relationships, all of the tasks are critical. The start of one task depends on the completion of the previous task. So, all of the tasks must start and finish on time without the project going astray.
If, however, you have assigned other types of relationships in your project, some of your tasks will be non-critical tasks:
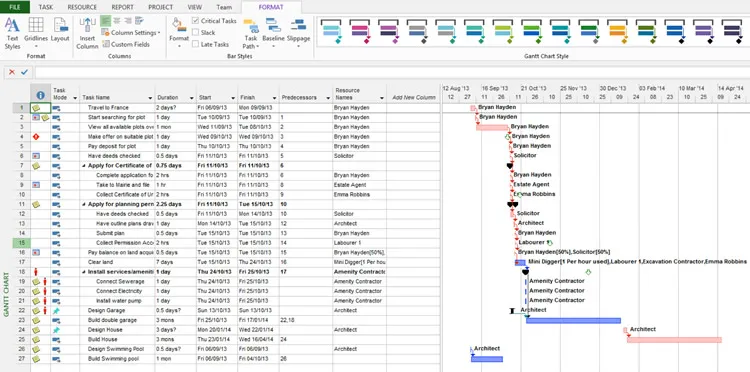
To view the critical path in the Gantt view
On the Format tab of the ribbon, click the Critical Path check box:
Changing Time Scale
The time scale of the Gantt Chart is change by using the Zoom Slider on the Status bar, but you can also use the Timescale dialog box to customise the way the Timescale is displayed:
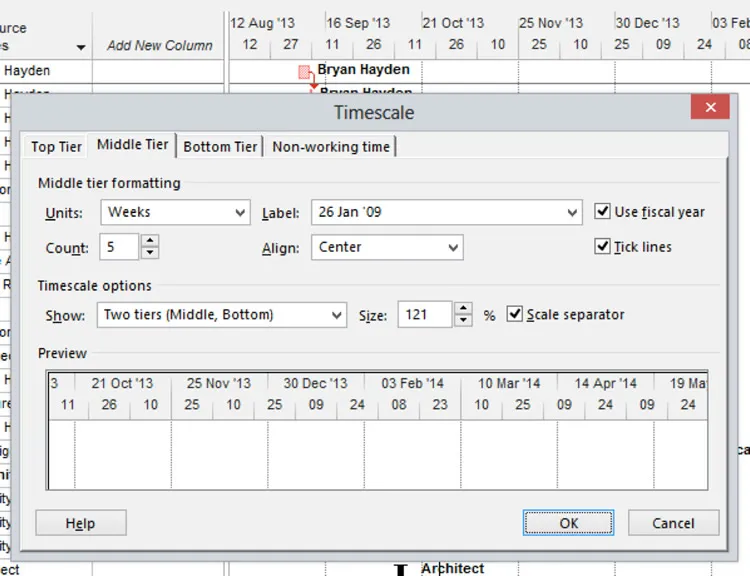
In the Timescale dialog box you can choose to display up to three tiers (Top, Middle and Bottom) and within each of these it is possible to alter the units, the label and the count of the interval.
Get a 60-day trial version of Project 2016 Professional.
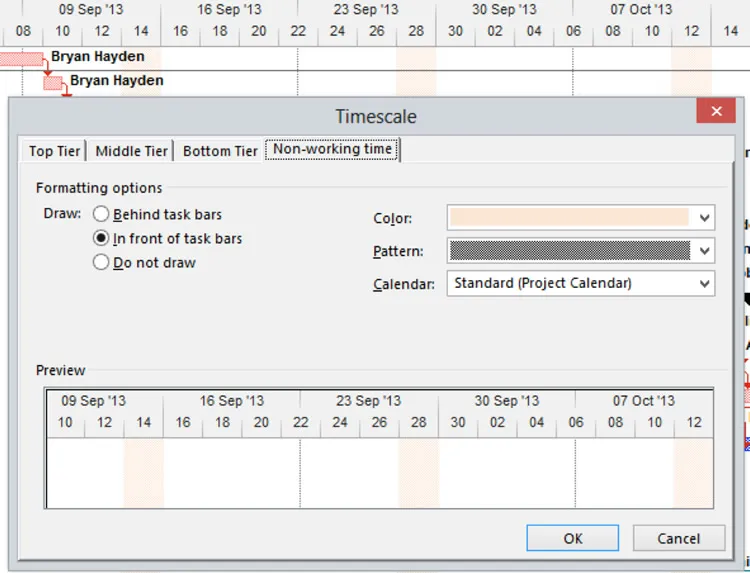
Formatting the non-working time
On the Non-working Time tab of the Timescale dialog box you can change the colour of the non-working time and whether it is displayed behind or in front of tasks. You can also choose which Calendar is displayed on the Gantt Chart:
Also see adding a new Gantt Bar.